

XDI acknowledges that we are on Aboriginal land and pay our respects to Elders past, present and future. We extend that respect to all Aboriginal and Torres Strait Islander peoples.
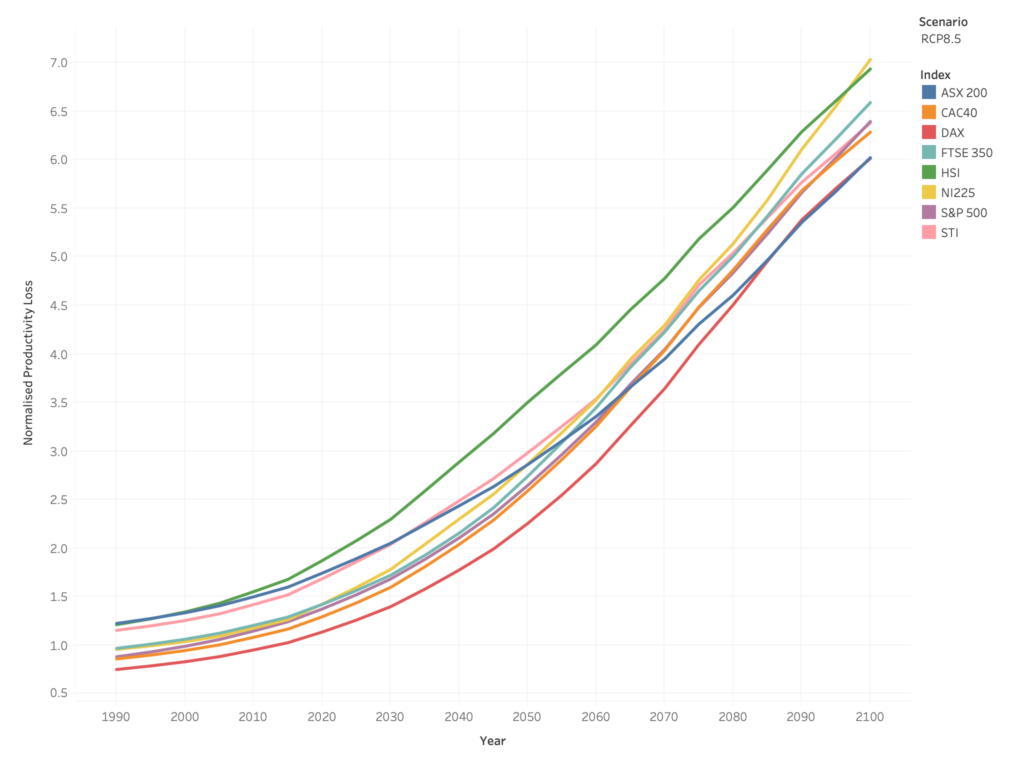
Physical risk to eight global indices shown from 1990 to 2100
A closer examination of 2020-2050
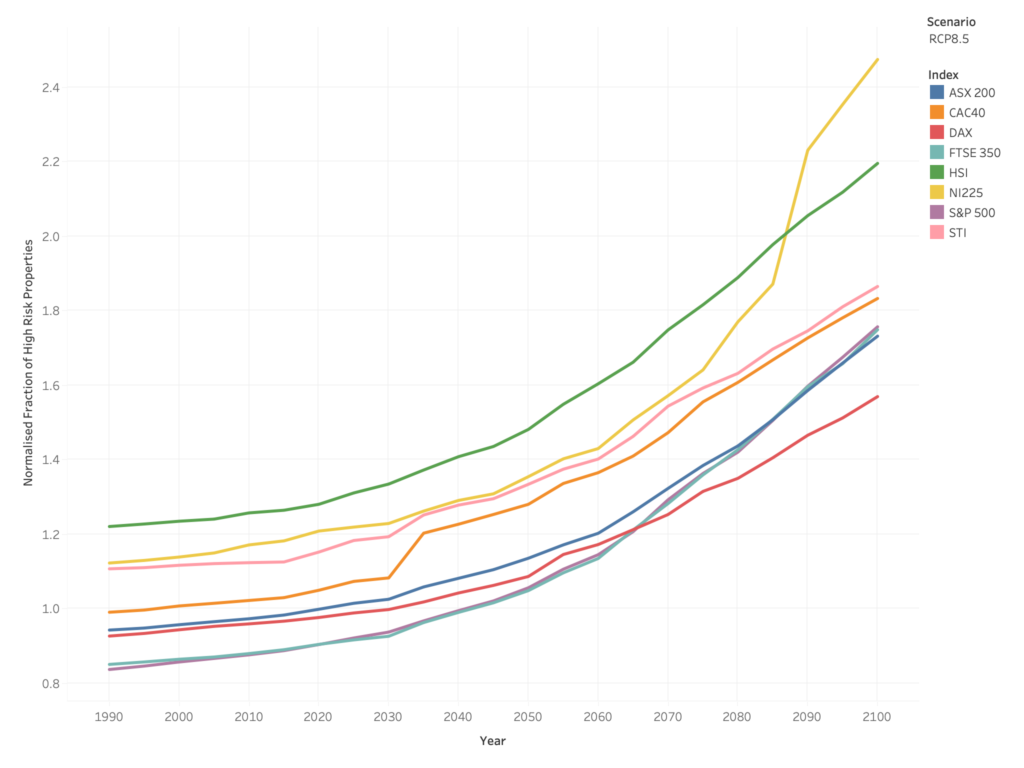
Physical risk to eight global indices shown from 1990 to 2100
A closer examination of 2020-2050

Physical risk to four automotive manufacturers shown over time
Observations
For the next two decades, the Japanese auto-manufacturer maintains the highest Maximum-to-Date Value-at-Risk (MVAR) and the US company is most exposed to Productivity Loss (PL). All companies see MVAR and PL increasing to the middle of the century. After the middle of the century, the maximum value-at-risk for the company listed in the UK rapidly escalates and reaches higher values than each of the other auto-manufacturers.
Productivity Loss over time
| Observations Productivity Loss best indicates revenue impairment, reflecting the lost productive availability of the asset for which the asset when it is assumed to be unfit to operate due to component failure, damage or repair.
|
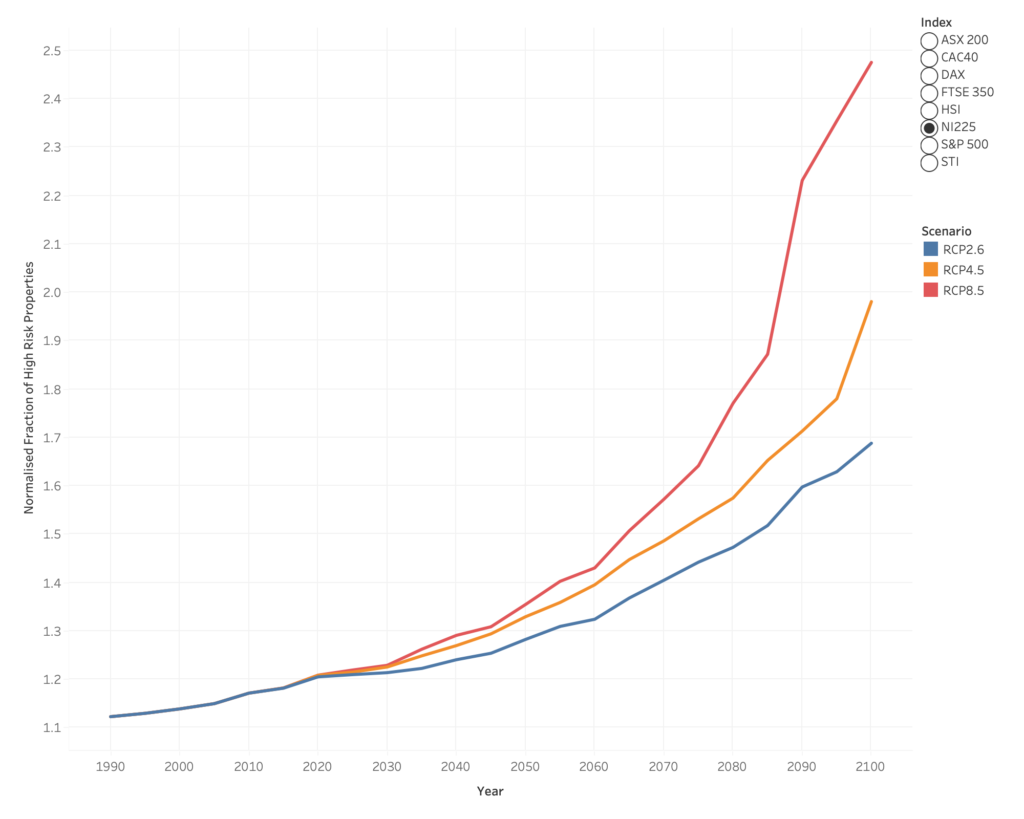
High Risk Properties over time
| Observations
|